Visualizing Europe’s GDP-Per-Capita By Country
Europe is home to some of the largest and most sophisticated economies in the world. But how do countries in the region compare with each other on a per capita productivity basis?
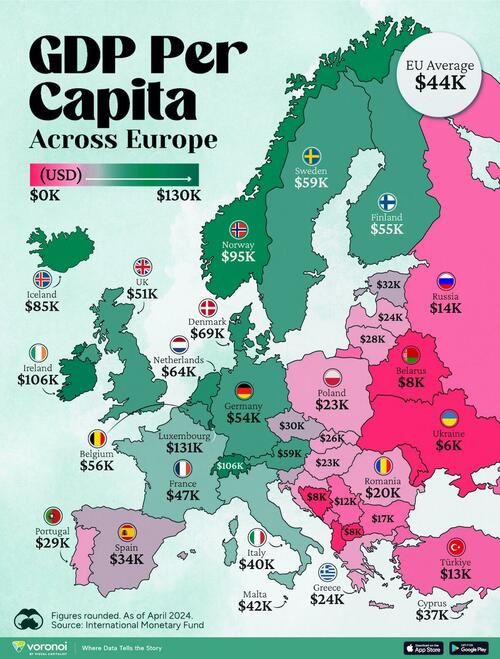
In this map, Visual Capitalist’s Pallavi Rao shows Europe’s GDP per capita levels across 44 nations in current U.S. dollars.
Data for this visualization and article is sourced from the International Monetary Fund (IMF) via their DataMapper tool, updated April 2024.
Europe’s Richest and Poorest Nations, By GDP Per Capita
Luxembourg, Ireland, and Switzerland, lead the list of Europe’s richest nations by GDP per capita, all above $100,000.
Note: Figures are rounded.
Three Nordic countries (Norway, Iceland, Denmark) also place highly, between $70,000-90,000. Other Nordic peers, Sweden and Finland rank just outside the top 10, between $55,000-60,000.
Meanwhile, Europe’s biggest economies in absolute terms, Germany, UK, and France, rank closer to the middle of the top 20, with GDP per capitas around $50,000.
Finally, at the end of the scale, Eastern Europe as a whole tends to have much lower per capita GDPs. In that group, Ukraine ranks last, at $5,660.
A Closer Look at Ukraine
For a broader comparison, Ukraine’s per capita GDP is similar to Iran ($5,310), El Salvador ($5,540), and Guatemala ($5,680).
According to experts, Ukraine’s economy has historically underperformed to expectations. After the fall of the Berlin Wall, the economy contracted for five straight years. Its transition to a Western, liberalized economic structure was overshadowed by widespread corruption, a limited taxpool, and few revenue sources.
Politically, its transformation from authoritarian regime to civil democracy has proved difficult, especially when it comes to institution building.
Finally, after the 2022 invasion of the country, Ukraine’s GDP contracted by 30% in a single year—the largest loss since independence. Large scale emigration—to the tune of six million refugees—is also playing a role.
Despite these challenges, the country’s economic growth has somewhat stabilized while fighting continues.
Tyler Durden
Fri, 05/10/2024 – 02:45


![Huti mają kilku sojuszników. Stąd wzięła się ich siła [WYJAŚNIAMY]](https://cdn.wiadomosci.onet.pl/1/_Qyk9lBaHR0cHM6Ly9vY2RuLmV1L3B1bHNjbXMvTURBXy83NjNlYzc4NmUyMWZlYjVlNDU0Y2E3ZWFkMTM4NzNjZi5qcGeSlQMczQQKzRN8zQr1kwXNCWDNBkDeAAKhMAehMQQ)